Streamlining Data Science: Navigating Experimentation Challenges with Tracking Tools
By ZoomInfo Engineering, Tara Crutchfield, January 10, 2024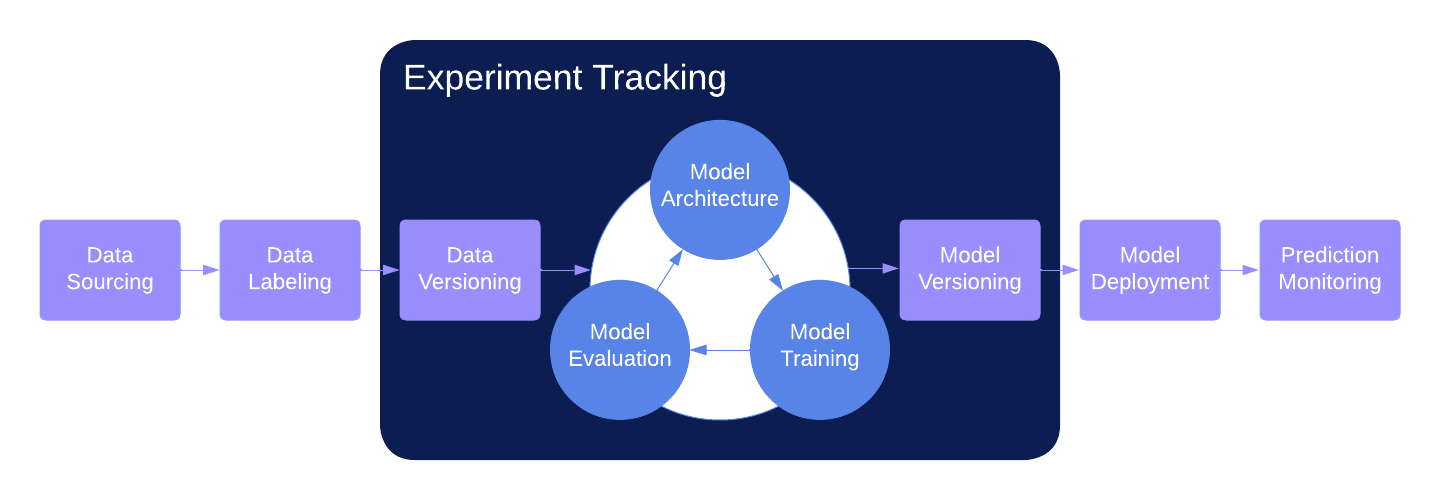

Experimentation is a key component of the data science workflow, encompassing everything from model hyperparameter tuning to addressing questions from stakeholders. While running ad-hoc experiments is an easy enough task, managing results becomes a challenge as experiments continue to grow and branch off of each other – not to mention the complexities of managing experiments within a large, multi-stage pipeline. As part of our efforts to address these challenges, our data science team decided to evaluate whether incorporating experiment tracking tools into our workflows could help.

At a high level, experiment tracking tools like MLFlow, Neptune, Comet, and Weights & Biases are meant to reduce friction across various stages of the Data Science lifecycle. They offer tools that track and version information so that Data Scientists can focus on their core objective: executing model training runs and analyzing results. After evaluating different experiment tracking products, we determined four main areas where these tools are most likely to improve our work efficiency: data management, data visualization, reproducibility, and observability. For the sake of simplicity, we’ll be focusing on the capabilities offered by Weights & Biases.
Data Management and Organization
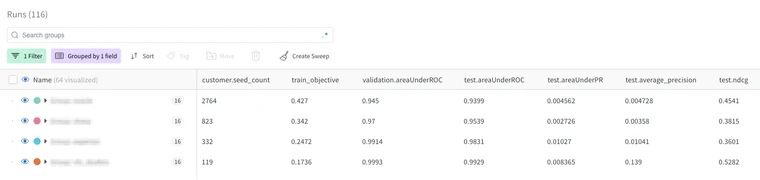
The main feature of experiment tracking systems is their data management capabilities including how data is logged, displayed, and organized for the data scientist to use for analysis. There are three main categories of logged information:
- Parameters: The input variables to track and compare across experiment runs (e.g. model hyperparameters).
- Metrics: The data generated to evaluate experiment run performance (e.g. trained model precision and recall).
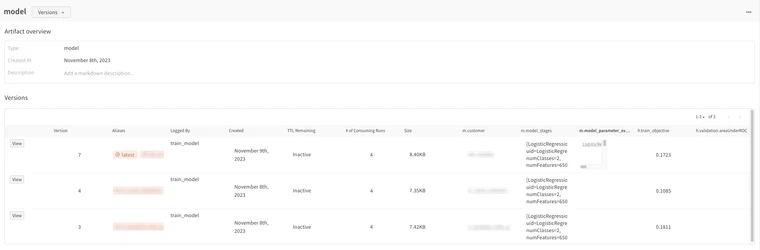
- Artifacts: Run generated assets such as datasets, models, or images to save and version (e.g. trained model).
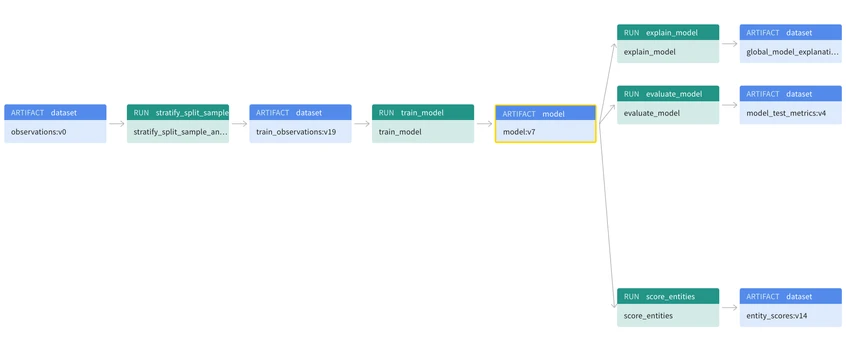
Run parameters and metrics are stored on the platform and are viewable as a table in the UI. Runs can then be tagged, filtered, and grouped so that users can manipulate the view of the table to better suit their needs. Artifacts are saved in a separate artifact store where users can view and load different versions of saved assets, as well as the artifact lineage which can be used to create links between different artifacts.
These features are useful because they handle the burden of saving and versioning data and provide a quick and easy way to check experiment progress and compare runs at a glance. The ability to filter and group runs allow Data Scientists to analyze, not just the results of a single run, but the combined results of aggregated runs as well. The run history also saves time on experimentation as some ad-hoc questions may be answered by analyzing previous runs rather than having to set up new experiments.
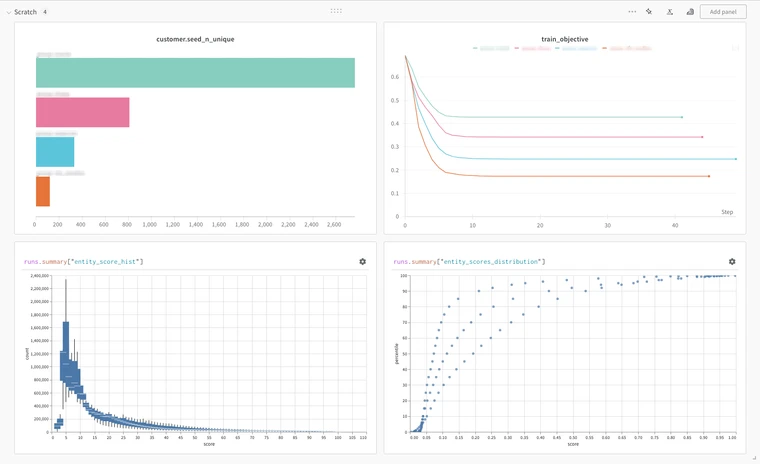
Data Visualization
Experiment tracking systems also offer a spectrum of data visualization tools directly in the UI. The simple graphing utilities, such as scatter plots and parallel coordinate plots, cover many of the basic needs for analyzing and comparing run metrics – and if that’s not enough, many also provide more complex and customizable options such as Weights & Biases Vega integration. Altogether, these tools help streamline experiment analysis by preventing the need to load logged data elsewhere to manually create plots.
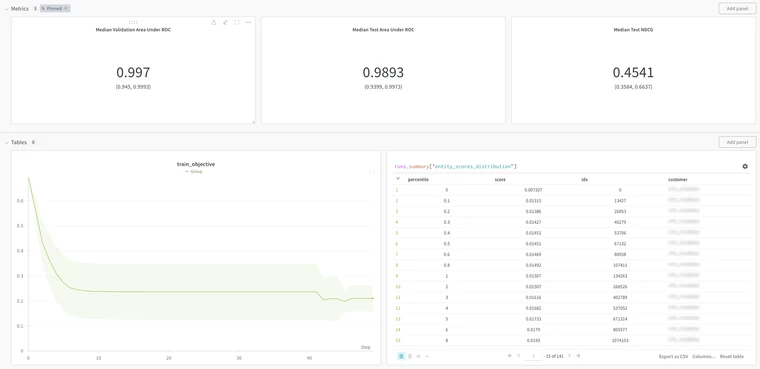
One particularly useful tool that some products offer is the reporting feature. Reports are a space to combine visualizations with markdown panels to document results and present conclusions. Graphs generated in the UI and logged table artifacts can be directly imported into a report and users can create preset filters to toggle between runs. All in all, reports are a nice feature that enable data scientists to quickly transform their analysis into a presentation, acting as the perfect place to compile results to share with stakeholders.
Reproducibility
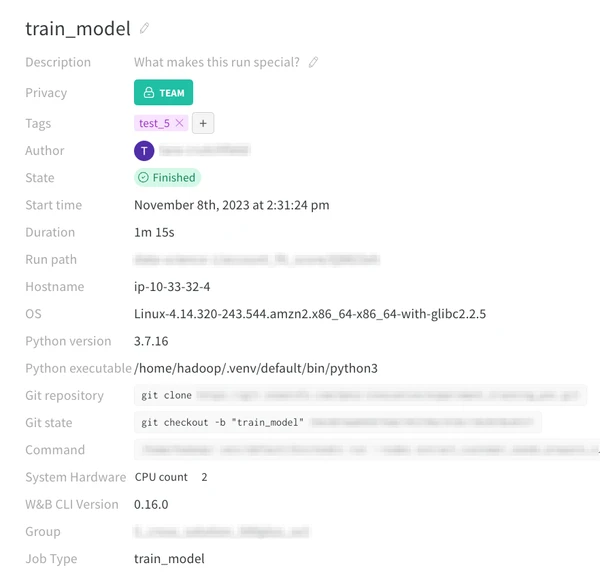
A major benefit of experiment tracking platforms is experiment reproducibility. Reproducibility can be a tricky problem to nail down, encompassing everything specific to a run including code, configuration, dependencies, and more. Experiment tracking systems cover these issues with a combination of automatically logged metrics and previously mentioned capabilities.
- Package requirements, git states, and run commands are automatically logged at the beginning of each run, providing insight into the state of a project and its working environment.
- Parameter logging keeps track of any run specific configurations, while metric and output logging saves the expected results.
- Artifact versioning and lineage tracking the input data sources from each run, as well as any upstream dependencies.
When combined, these features create a complete picture of each run, enabling both the run creator and other collaborators to view and replicate runs. This can be especially helpful during project hand-offs by keeping track of all requirements a project needs to run successfully and as expected.
Observability and Collaboration
Together, all of the above tools increase project observability and help facilitate collaboration. Logged runs are visible to everyone with access to the platform and each user has their own workspace to create their own separate views. These views save how each user groups and filters their runs as well as the graphs they’ve created and their placement in the UI. While workspaces are shared among users, each view is independent, allowing others to gain insight into how a user is organizing their experiments without disrupting their space.
Another useful feature is standard output logging, which we found helpful for pair programming and debugging, especially when working in a remote development setting where logs can be tricky to access and slow to load.
These features alone are incredibly useful for understanding how each data scientist is approaching their experiments. When combined with the data lineage, these tools illuminate where these experiments fit in the grand scheme of the overall pipeline– sharing the story behind the questions a Data Scientist is trying to answer and how they’re going to answer it.
Conclusion
Overall our team found that experiment tracking systems are incredibly useful tools that offer a space to centralize data science experiments, removing the friction experienced when shifting between the different phases of experimentation. The efficiency boost these tools offer enable data scientists to draw conclusions faster – in turn opening up resources for rapid iterations, more experiments, and increased productivity gains. We found a lot of potential in all of the services these platforms have to offer and are excited to implement them into our workflows in the future.
References
- Weights & Biases Docs (2024) https://docs.wandb.ai/guides
- MLflow Docs (Version 2.9.2) https://mlflow.org/docs/latest/introduction/index.html
- Comet Docs (Version 2.3.65) https://www.comet.com/docs/v2/guides/getting-started/what-is-comet/